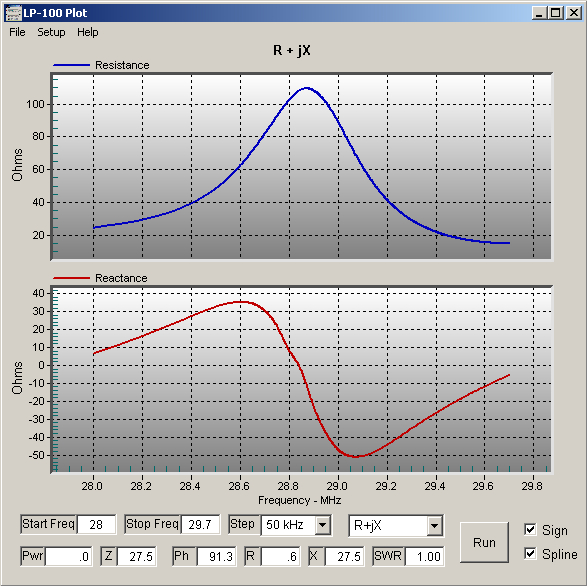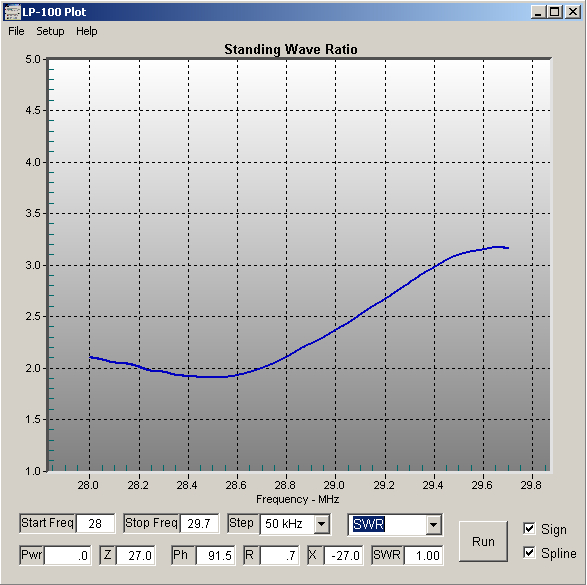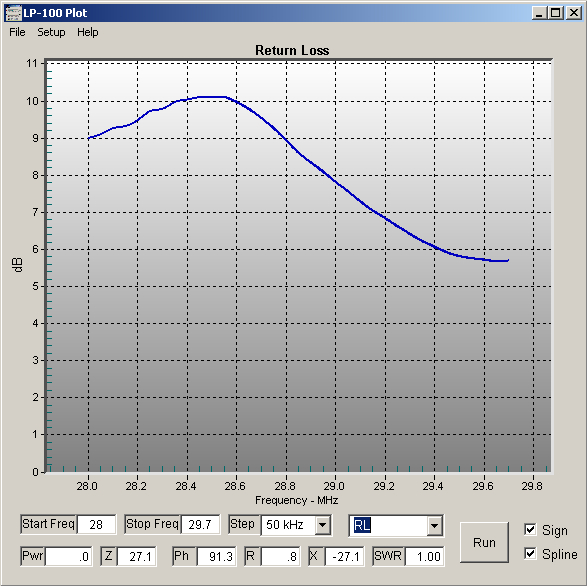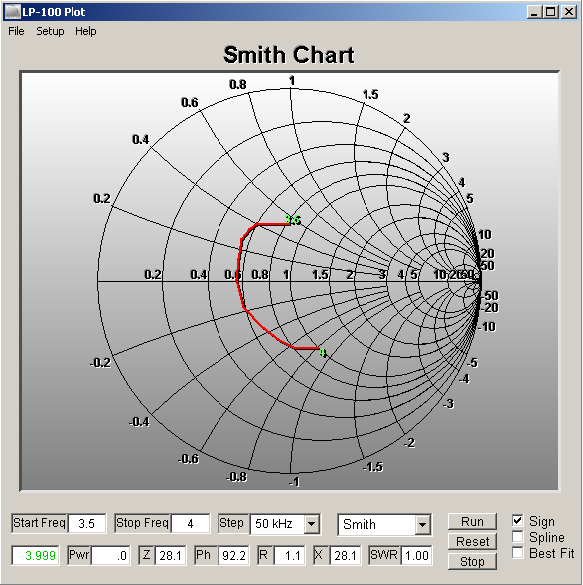
Transmission Mode Plots...
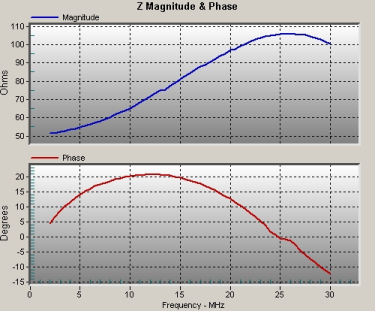
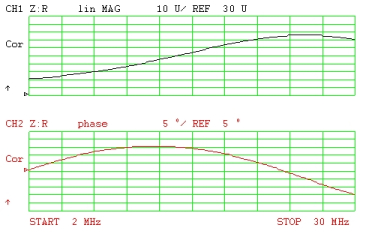
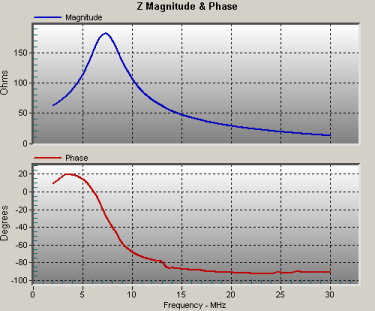
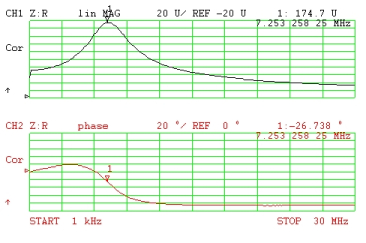
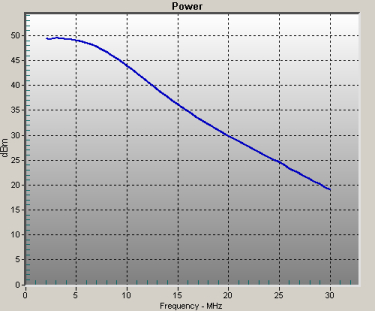
Below are some reduced size plots of a
pi net low-pass filter, showing a reflection measurement of impedance
and transmission measurement of power response, using the newly added
power option of the Plot program. This test was done just to see how it
would look. A practical application of this could be plotting bandpass
filters for multi-multi contest stations. As above, the green plots are
from my HP 87510A VNA. On the first pair, the HP plot starts at 1kHz,
so that's why the curve looks expanded on the low end. Correlation
between the two is within 2% for magnitude, and 2 degrees for phase in
this case.
Correlation on the power response is within about 2 dB, but is affected
by the SWR power reduction in the rig (TS-480S in this case). To
minimize this I used a precision attenuator on the output of the rig,
and the direct inputs of the LP-100 for more sensitivity. This is a
really nice
feature of the LP-100 Plot program combo. Antenna analyzers, being
1-port
devices, only allow reflection measurements. This includes every
antenna analyzer I know of, handheld or PC based. VNAs on the other
hand, do allow this type of measurement. For many
of the things you would measure with a VNA, the LP-100 / Plot program
may be adequate. The main disadvantages vs. a HP or N2PK would be
resolution, dynamic range and power accuracy, which is dependent on the
rig being used as a source. Those devices are capable of producing
results within 0.001
to 0.01 dB, and have dyamic range of 100 dB. The LP-100 has very good
power accuracy, of course, but is limited to 50 dB dynamic range.
The accuracy of the LP-100 / Plot combo for transmission measurements
is largely controlled by the transmitter. In my case, the TS-480S I use
for measurements has an error of about 1 dB from 2-30 MHz, but it's
proportional and easy to account for. In fact, a correction could be
added in the Plot program to compensate for the transmitter response.
For all practical purposes, this would not make much difference in its
usability in this mode, which is mainly one of seeing response curve
shape, mismatch problems with filters, etc.
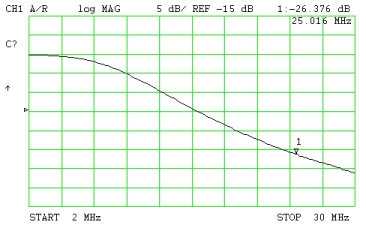
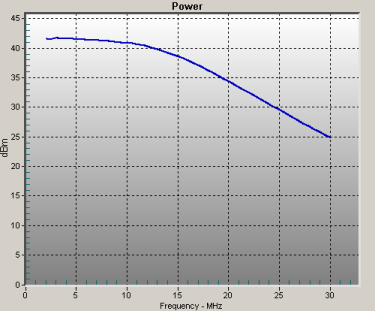
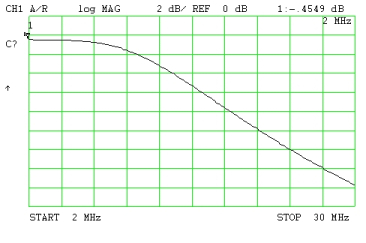
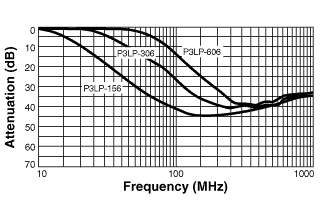
Below are transmission measurements of a
Coilcraft P3LP-156 low pass filter, including the published curve for
this filter. The LP-100 does nicely here as well. Again, the only
anomaly is the 1 dB power drop of the TS-480S from 2-30 MHz.
Here transmission plots of a coax stub
tuned to 7 MHz...
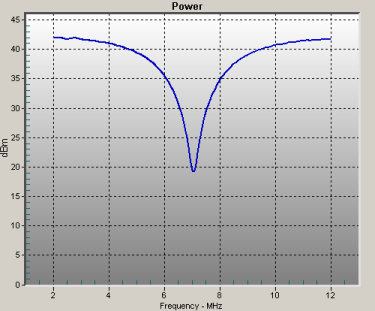
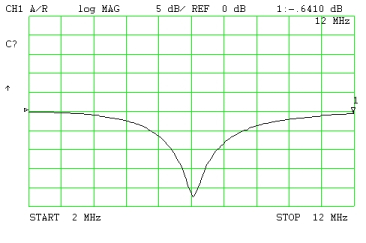
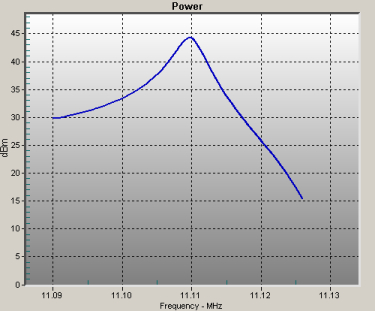
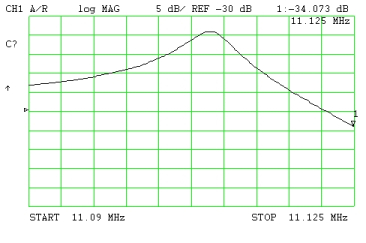
...and here are plots of a 11.1125 MHz
xtal. No attempt was made to resonate the xtal. I did add series
resistors to approximate a match, however. These plots show the
excellent correlation between my LP-100 and my HP VNA.
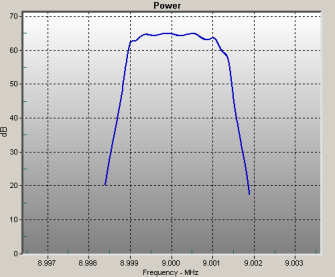
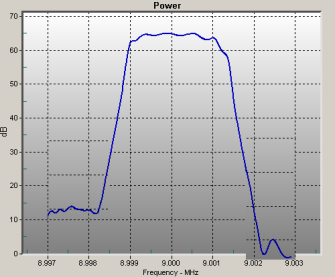
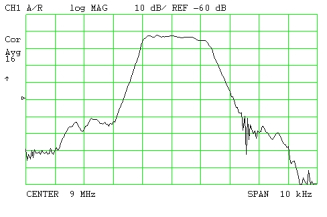
And here are plots of a KVG XF9B crystal
filter. I matched the 500 ohm input and output Z for this test, but I
did not add the required 30pF shunt caps to minimize the ripple. Since
the LP-100 only has about 50 dB dynamic range, I made two passes at
different levels and stitched the results together in Photoshop. The
far left picture is the original LP-100 sweep, the righthand picture is
the stitched sweeps, and the bottom picture is a sweep with my HP87510A
VNA. The LP-100 sweep width is 6 kHz, and step size is 0.1 kHz.
